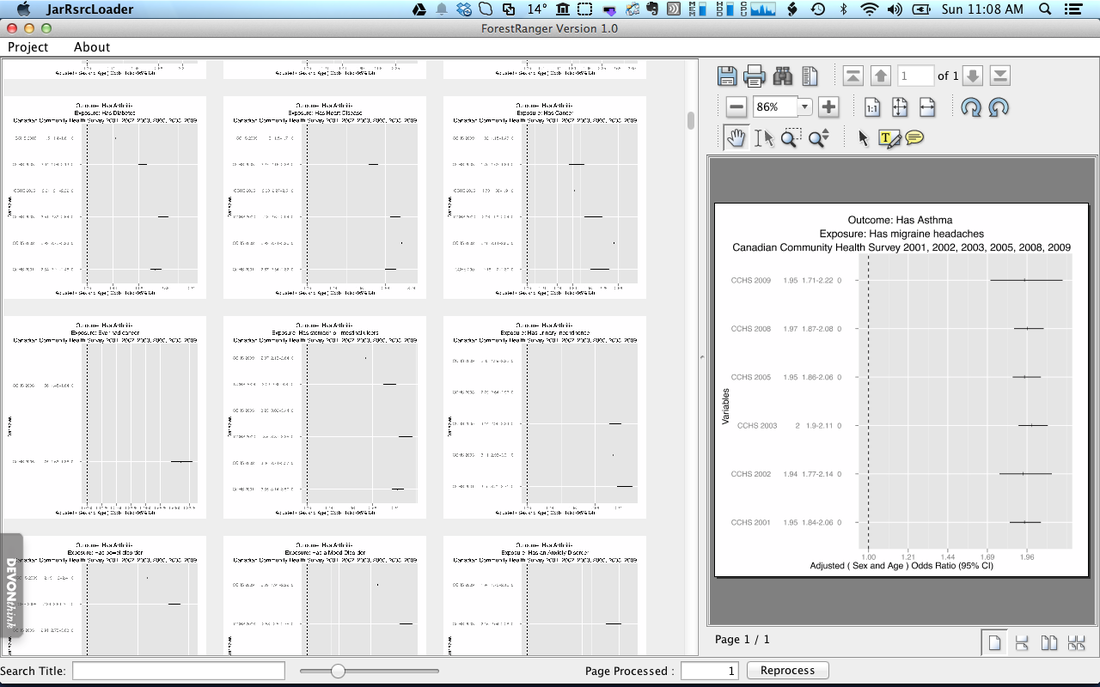
Forest Ranger (2014) – ForestRanger is an application for visualizing large amount of Forest Plots generated from cross sectional surveys (i.e. Canadian Community Health Survey – CCHS). The Forest Plot(s) report on the association between outcome and exposure variables (i.e. Stroke versus Hypertension adjusted by sex and age) broken down by survey year (i.e. 2008, 2007, 2006, 2005, etc.). For a chronic disease series of reports there could be 20 variables reported on which would correspond to approximately 400 charts. ForestRanger allows a researcher to quickly see which associations are increasing or decreasing or have the greatest Odds Ratios (OR) of the associations. The researcher can then click on the chart of interest and the larger report appears on the right hand side. ForestRanger can be used for visualizing any directory of PDFs.
Grreat share